Showing posts with label Flooding. Show all posts
Showing posts with label Flooding. Show all posts
Tuesday, 12 August 2014
Assessment of Swan and Canning River Tidal and Storm Surge Water Levels - Alan Forster (URS)
Presented at the 2014 MIKE by DHI UK Symposium on 13th to 14th May 2014.
Assessment of Swan and Canning River Tidal and Storm Surge Water Levels - Alan Forster (URS) from sjf_dhi
Presented at the 2014 MIKE by DHI UK Symposium on 13th to 14th May 2014.
From Hazard to Impact: The CORFU flood damage assessment tool - Albert S. Chen (University of Exeter)
Presented at the 2014 MIKE by DHI UK Symposium on 13th to 14th May 2014.
From Hazard to Impact: The CORFU flood damage assessment tool - Albert S. Chen (University of Exeter) from sjf_dhi
Presented at the 2014 MIKE by DHI UK Symposium on 13th to 14th May 2014.
Undertaking Modelling of Flooding due to Wave Overtopping using the MIKE by DHI Software Suite - Dr Suzie Clarke (DHI)
This presentation outlines the basis for one of the methodologies that can be followed in order to simulate the flooding of coastal areas due to overtopping of coastal defences by extreme or storm wave conditions. It is not expected that the slides are exhaustive in detail, nor present the only approach, but are provided to give basic guidance for all experience levels. Care is advised when following this methodology and all results should be subjected to reasonable checking.
Read the full Executive Summary here.
Undertaking Modelling of Flooding due to Wave Overtopping using the MIKE by DHI Software Suite - Dr Suzie Clarke (DHI) from sjf_dhi
This presentation outlines the basis for one of the methodologies that can be followed in order to simulate the flooding of coastal areas due to overtopping of coastal defences by extreme or storm wave conditions. It is not expected that the slides are exhaustive in detail, nor present the only approach, but are provided to give basic guidance for all experience levels. Care is advised when following this methodology and all results should be subjected to reasonable checking.
Read the full Executive Summary here.
Thursday, 17 April 2014
Assessing The Impacts Of Rural Land Management Change On Flooding And Flood Risk (The Catchment Approach)
Following on from this post, a few more links focussing on the work of Jong-Sook Park for the Parrett catchment in SW England and its Tone subcatchment: -
Following on from this post, a few more links focussing on the work of Jong-Sook Park for the Parrett catchment in SW England and its Tone subcatchment: -
- http://www.hydrology.org.uk/assets/2010%20papers/035Park_etal.pdf
- https://workspace.imperial.ac.uk/ewre/Public/McIntyre_36.pdf
- http://riverscience.wdfiles.com/local--files/workshop-programme/Park.pdf
Friday, 26 July 2013
Assessing The Impacts Of Rural Land Management Change On Flooding And Flood Risk (The Catchment Approach)
MIKE SHE is a very powerful tool for assessing the effects of natural flood management schemes in the UK. The software has been used extensively for modelling wetland restoration in upland areas in different parts of the world.
The effects of tree planting, water meadows, and other riparian planting can be described by land use changes in the model and the impacts on evapotranspiration, unsaturated flow and surface runoff examined. It is also possible to describe the detention of water in the floodplain (e.g. as a result of tree planting, landscaping, etc).
The effects of cutting off drains, and altering surface flow routes, can be modelled using the MIKE SHE 2D Overland Flow module. Channel restoration and green bank protection can be handled by coupling to MIKE 11.
Natural flood management has many benefits (habitat creation, nature conservation, diffuse pollution mitigation, etc) and is of particular interest in rural rapid response catchments; where it is not always possible to provide flood defences.
A selection of useful (external) documents, papers and links can be found below: -
MIKE SHE is a very powerful tool for assessing the effects of natural flood management schemes in the UK. The software has been used extensively for modelling wetland restoration in upland areas in different parts of the world.
The effects of tree planting, water meadows, and other riparian planting can be described by land use changes in the model and the impacts on evapotranspiration, unsaturated flow and surface runoff examined. It is also possible to describe the detention of water in the floodplain (e.g. as a result of tree planting, landscaping, etc).
 |
| Photo: iStock © Василий Тороус |
Natural flood management has many benefits (habitat creation, nature conservation, diffuse pollution mitigation, etc) and is of particular interest in rural rapid response catchments; where it is not always possible to provide flood defences.
A selection of useful (external) documents, papers and links can be found below: -
- Working with Natural Processes to Manage Flood and Coastal Erosion Risk (Environment Agency, 2010)
- An Inventory of Mitigation Methods and Guide to their Effects on Diffuse Water Pollution, Greenhouse Gas Emissions and Ammonia Emissions from Agriculture (ADAS, 2011)
- Slowing the Flow - A natural solution to flooding problems (WWF Scotland)
- Holnicote Multi-Objective Flood Management Demonstration Project - An Analysis of the Impacts of Rural Land Management Change on Flooding and Flood Risk (JBA, Penny Anderson Associates & National Trust)
- The Holnicote Project - Integrated Catchment Management in Practice (EA and National Trust)
- Catchment Change Management Hub
- Demonstrating Catchment Management - Learning from the Demonstration Test Catchment projects
- Demonstration Test Catchment Data Archive
- WFDVisual - Water Framework Directive Visualisation tool (SNIFFER)
Tuesday, 23 July 2013
Simulation of Coastal Inundation by Waves Using MIKE 21
Inundation by storm surges and tsunamis, as well as smaller storm waves, is a considerable risk faced by coastal communities. Over the past few years, flood events on the eastern coast of the USA, as well as in Japan and the Indian Ocean, for example, have highlighted the need for an understanding of potential impacts. The instructional document here presents a summary of methods (as previously used by DHI) for investigating large wave inundation using MIKE by DHI software: -
This document is for information only and does not constitute consultancy advice (No liability for the consequences of any actions taken on the basis of the advice provided is accepted).
Inundation by storm surges and tsunamis, as well as smaller storm waves, is a considerable risk faced by coastal communities. Over the past few years, flood events on the eastern coast of the USA, as well as in Japan and the Indian Ocean, for example, have highlighted the need for an understanding of potential impacts. The instructional document here presents a summary of methods (as previously used by DHI) for investigating large wave inundation using MIKE by DHI software: -
This document is for information only and does not constitute consultancy advice (No liability for the consequences of any actions taken on the basis of the advice provided is accepted).
Sharing Experiences of Flood Modelling Using MIKE 21
Although unfortunately unable to attend in person this year, Lei Yang of Arup prepared two case studies of flood modelling using MIKE 21 FMHD detailing the typical issues raised and addressed by Flood Risk Assessments. Case 1 includes comments on the use of a one-dimensional weir structure in a coastal flooding scenario. Case 2 includes the use of buried culverts in an inland site with three brooks and a recorded history of flooding.
Although unfortunately unable to attend in person this year, Lei Yang of Arup prepared two case studies of flood modelling using MIKE 21 FMHD detailing the typical issues raised and addressed by Flood Risk Assessments. Case 1 includes comments on the use of a one-dimensional weir structure in a coastal flooding scenario. Case 2 includes the use of buried culverts in an inland site with three brooks and a recorded history of flooding.
Monday, 20 May 2013
CIWEM Surface Water Flooding and Management 2013 - Plans, Delivery & Funding
26 June 2013 - London, UK
DHI is pleased to sponsor the CIWEM Surface Water Flooding and Management Conference 2013. We will be at the event in London on the 26th June 2013 and are very happy to extend an invitation to clients and partners, to discuss the newest developments in the market, and to share visions and ideas on future opportunities.
If you would like to arrange a short, informal meeting in advance, please contact Steve Flood on +44 1752 691723 or e-mail sjf@dhigroup.com
We look forward to seeing you!
26 June 2013 - London, UK
DHI is pleased to sponsor the CIWEM Surface Water Flooding and Management Conference 2013. We will be at the event in London on the 26th June 2013 and are very happy to extend an invitation to clients and partners, to discuss the newest developments in the market, and to share visions and ideas on future opportunities.
If you would like to arrange a short, informal meeting in advance, please contact Steve Flood on +44 1752 691723 or e-mail sjf@dhigroup.com
We look forward to seeing you!
Tuesday, 14 May 2013
ICE Flooding 2013 - Developing Flood Resilient Communities
23 May 2013 - London, UK
DHI will be at the ICE Flooding Conference 2013 in London on the 23rd May 2013 and are very happy to extend an invitation to clients and partners, to discuss the newest developments in the market, and to share visions and ideas on future opportunities.
If you would like to arrange a short, informal meeting in advance, please contact Steve Flood on +44 1752 691723 or e-mail sjf@dhigroup.com
We look forward to seeing you!
23 May 2013 - London, UK
DHI will be at the ICE Flooding Conference 2013 in London on the 23rd May 2013 and are very happy to extend an invitation to clients and partners, to discuss the newest developments in the market, and to share visions and ideas on future opportunities.
If you would like to arrange a short, informal meeting in advance, please contact Steve Flood on +44 1752 691723 or e-mail sjf@dhigroup.com
We look forward to seeing you!
Sunday, 25 November 2012
Australian Rainfall and Runoff 2012 (AR&R) Guidelines Launched: Two Dimensional Modelling in Urban and Rural floodplains
 Engineers Australia has published new guidelines on Two Dimensional Modelling in Urban and Rural Floodplains. The guidelines have been prepared for the National Committee on Water Engineering as one of the Australian Rainfall and Runoff Revision Projects.
The Guidelines review current practice in 2D modelling, including areas where current practice is not supported by theoretical and empirical research, and provide guidance on appropriate development and usage of 2D hydrodynamic models for floodplain applications.
While tailored to Australian flood risk legislation, UK users of MIKE FLOOD may find the report of interest (particularly, for instance, the sections on building representation and the use of eddy viscosity in 2D inundation models).
The report builds in part upon the research undertaken by Grantley Smith (University of Newcastle, NSW) on 2D Flood Modelling in Urban Areas (specifically in Merewether; a suburb of Newcastle, New South Wales) which he presented at the 2012 UK User Group Meeting.
The Guidelines review current practice in 2D modelling, including areas where current practice is not supported by theoretical and empirical research, and provide guidance on appropriate development and usage of 2D hydrodynamic models for floodplain applications.
While tailored to Australian flood risk legislation, UK users of MIKE FLOOD may find the report of interest (particularly, for instance, the sections on building representation and the use of eddy viscosity in 2D inundation models).
The report builds in part upon the research undertaken by Grantley Smith (University of Newcastle, NSW) on 2D Flood Modelling in Urban Areas (specifically in Merewether; a suburb of Newcastle, New South Wales) which he presented at the 2012 UK User Group Meeting.
Monday, 9 July 2012
Heavy rain floods Plymouth, Yealmpton, Modbury and surrounding communities
The morning of Saturday 7th July 2012 saw Ivybridge, Yealmpton and Modbury hit by torrential rain and floods, while there was also localised flooding in and around Plymouth with a number of roads closed to traffic and transport services disrupted. Read more from 'This is Plymouth' >>>
Flooding in Sidmouth on 7th July 2012 (video by Fizzywack)
Flooding in Yealmpton on 7th July 2012 (video by Rubysdog)
Other news articles (with pictures) from around the web: -
River Erme after the flooding on 7th July 2012 (video by S.Lowery)
More news: -
.
The morning of Saturday 7th July 2012 saw Ivybridge, Yealmpton and Modbury hit by torrential rain and floods, while there was also localised flooding in and around Plymouth with a number of roads closed to traffic and transport services disrupted. Read more from 'This is Plymouth' >>>
Flooding in Sidmouth on 7th July 2012 (video by Fizzywack)
Flooding in Yealmpton on 7th July 2012 (video by Rubysdog)
Other news articles (with pictures) from around the web: -
- http://www.bbc.co.uk/news/uk-18750430
- http://www.bbc.co.uk/news/uk-18753537
- http://www.itv.com/news/westcountry/2012-07-07/heavy-rain-leaves-properties-flooded-and-residents-trapped/
- http://www.itv.com/news/2012-07-08/communities-count-cost-of-flooding/
- http://www.dailymail.co.uk/news/article-2170056/Met-Office-warns-lives-risk-issues-highest-level-alert-3ins-rain-fall-overnight-horrendous-downpours.html
- http://www.thesun.co.uk/sol/homepage/news/4416373/Man-dies-as-deluge-continues.html
River Erme after the flooding on 7th July 2012 (video by S.Lowery)
More news: -
.
Friday, 9 September 2011
Animated visualization of a 3D groundwater model for a flooded salt mine (Stereoscopic 3D)
To turn off stereoscopic 3D, click the red '3D' icon on the bottom navigation bar while the animation is running.
Objective of the project
Using the abandoned and flooded historical salt mine located near Staßfurt, Germany, as a case study, improve the general knowledge of the dynamics of naturally or intentionally flooded salt mines.
Approach
A regional three-dimensional mass-transport FEFLOW® model was built for the project area, including detailed 3D geometric schematizations of the mine workings.
In addition two-dimensional type-models were computed, for instance to study chemical reaction kinetics, where NaCl and MgCl2 represent the dominant salt species. Precipitation and dissolution are controlled by the amount of available MgCl2, due to this the bulk density is affected. Furthermore, permeability and porosity are also modified dynamically by precipitation and dissolution.
Benefit
Applying the FEFLOW® model it could be shown that the relevant processes in a flooded salt-mine can be modelled, precipitation and dissolution reactive processes for multi-species and multi-density processes can be modelled in type models, using the advanced visualisation possibilities of FEFLOW 6 the set-up of such a model can be speeded up, runtimes can be kept reasonably short by using parallelization.
For more information, please visit http://www.feflow.info/
To turn off stereoscopic 3D, click the red '3D' icon on the bottom navigation bar while the animation is running.
Objective of the project
Using the abandoned and flooded historical salt mine located near Staßfurt, Germany, as a case study, improve the general knowledge of the dynamics of naturally or intentionally flooded salt mines.
Approach
A regional three-dimensional mass-transport FEFLOW® model was built for the project area, including detailed 3D geometric schematizations of the mine workings.
In addition two-dimensional type-models were computed, for instance to study chemical reaction kinetics, where NaCl and MgCl2 represent the dominant salt species. Precipitation and dissolution are controlled by the amount of available MgCl2, due to this the bulk density is affected. Furthermore, permeability and porosity are also modified dynamically by precipitation and dissolution.
Benefit
Applying the FEFLOW® model it could be shown that the relevant processes in a flooded salt-mine can be modelled, precipitation and dissolution reactive processes for multi-species and multi-density processes can be modelled in type models, using the advanced visualisation possibilities of FEFLOW 6 the set-up of such a model can be speeded up, runtimes can be kept reasonably short by using parallelization.
Potential Applications
Mine flooding can not only alter underground hydrogeology, but also cause the collapse of mine workings (potentially exacerbating groundwater related flooding elsewhere), ground subsidence and damage to surface structures both in the mine and in the surrounding area. FEFLOW can be used to model the long term performance of flooding control measures, as well as dewatering works, in operational and abandoned mine workings - particularly important where rock formations are highly prone to chemical attack and erosion (e.g. gypsum mines). FEFLOW can also be used to validate remediation schemes for groundwater contaminated by mining activity.
For more information, please visit http://www.feflow.info/
.
Tuesday, 8 February 2011
Example tidal inundation model at Sutton Harbour, Plymouth using standard structures available within MIKE 21 Flexible Mesh
Introduction
 The Sutton Harbour area of Plymouth is defended against tidal flooding primarily by a system of lock gates at the entrance to the inner harbour. It is understood that the defended level afforded by the lock gates is 4.03m A.O.D (although a number of openings in the parapet wall of the southern harbour wall may slightly compromise the level of defence). This example investigates the suitability of the existing defences to accommodate a 1 in 200-year tidal event plus an allowance for climate change.
 LIDAR data, for use in the model, was obtained from the Channel Coastal Observatory Data Catalogue here http://www.channelcoast.org/. Downloading data and reports from the Channel Coastal Observatory Data Catalogue is currently free of charge (registration is required).
Introduction

Additional notes: It is assumed that all surface water outfalls into the inner harbour have been bypassed; hence, flooding from urban drainage has been ignored. No assessment of wave height has been included within this example. The aerial photograph above was obtained from the Channel Coastal Observatory Data Catalogue (see below).

Additional notes: CCO LIDAR data was verified by comparison with EA LIDAR data and augmented by additional depth values.
Tuesday, 20 April 2010
Simulation of dam break flow around buildings using a high-resolution MIKE FLOOD FM (Flexible Mesh) model
Introduction
The following example is intended to augment the MIKE FLOOD Classic (SG) results presented within the forthcoming Environment Agency Science Report 'Benchmarking of 2D Hydraulic Modelling Packages'. Information on this study can currently be found in the 'Desktop Review of 2D Hydraulic Software Packages' report; available here (opens PDF document).
This dam break test has been adapted from an original benchmark test case available from the IMPACT project (IMPACT, 2004; Soares-Frazao and Zech, 2002), for which measurements from a physical laboratory model at the Civil Engineering Laboratory of the Université Catholique de Louvain (UCL) are available. The test involves a simple topography, a dam with a 1.0m wide opening, and an idealised representation of a single building downstream of the dam.

Software used
Product: MIKE FLOOD FM (Flexible Mesh)
Version: 2009 including Service Pack 3
Numerical scheme: Finite Volume (FV) [2]
Hardware used
Processor type: Intel Core 2 Quad CPU Q9450
Speed: 2.66 GHz
RAM: 4.00 GB
Model Parameters
 Model bathymetry: Triangular elements have been used to improve the definition of the building as above (quadrangular elements have been used elsewhere, at an approximate grid resolution of 0.1m, particularly to improve definition of model bathymetry along the base slopes and to refine flow through the gate opening).
Time increment (s): 0.02 (adaptive 0.001 - 0.02)
Flood and Dry: Drying depth = 0.001, Flooding depth = 0.002 & Wetting depth = 0.005
Eddy viscosity (m2/s): Smagorinsky formulation (default)
Bed resistance: Manning's M = 100
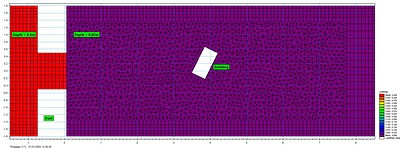 Initial conditions: Uniform depths of 0.4m upstream from the dam and 0.02m downstream from the dam.
 Boundary conditions: Flow is contained by vertical walls at all boundaries of the model domain (only a section of the full model is presented above).
Model Results
Grid resolution (m): 38053 nodes / 38690 elements
Total simulation time (s): 149
 Maximum water surface elevations reached during the simulation (m); transformed 0.05m grid resolution.
 Maximum velocities reached during the simulation (m/s); transformed 0.05m grid resolution.
 MIKE 21 Flow Model FM point series output locations.
 Plot of water surface elevation against time for all point series output locations (m)
 Plot of velocity against time for all point series output locations (m/s)

Introduction
The following example is intended to augment the MIKE FLOOD Classic (SG) results presented within the forthcoming Environment Agency Science Report 'Benchmarking of 2D Hydraulic Modelling Packages'. Information on this study can currently be found in the 'Desktop Review of 2D Hydraulic Software Packages' report; available here (opens PDF document).
This dam break test has been adapted from an original benchmark test case available from the IMPACT project (IMPACT, 2004; Soares-Frazao and Zech, 2002), for which measurements from a physical laboratory model at the Civil Engineering Laboratory of the Université Catholique de Louvain (UCL) are available. The test involves a simple topography, a dam with a 1.0m wide opening, and an idealised representation of a single building downstream of the dam.
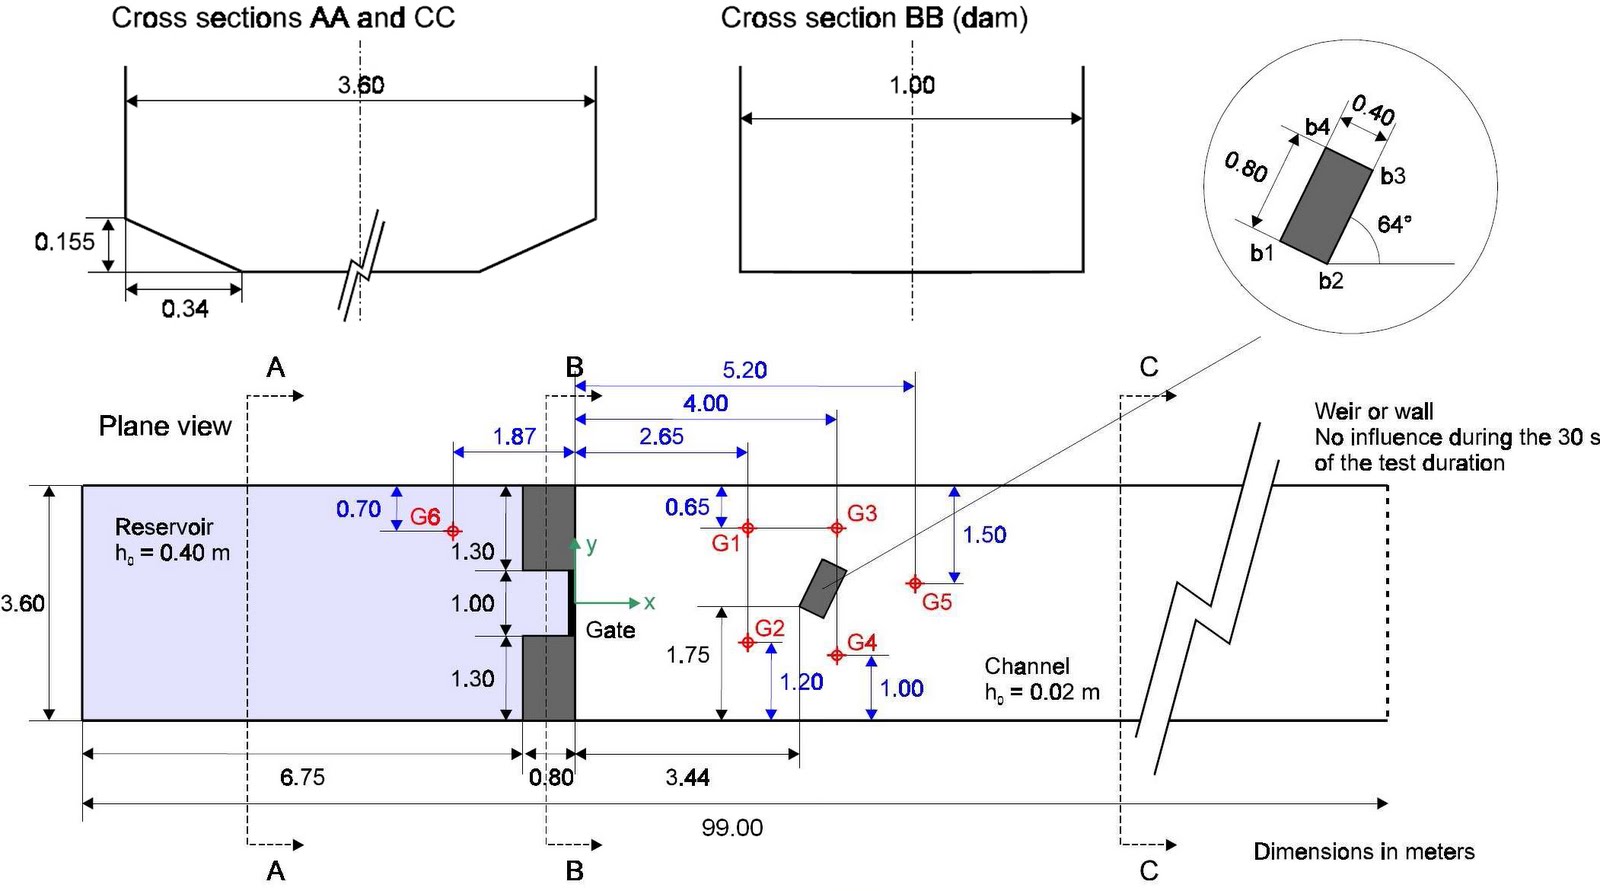
Model Set-up (adapted from Soares-Frazao and Zech, 2002).
[1] The SOARES-FRAZAO, S. AND ZECH, Y., 2002 Dam break flow experiment (Isolated building test case) is available online at http://www.impact-project.net/wp3_technical.htm
Software used
Product: MIKE FLOOD FM (Flexible Mesh)
Version: 2009 including Service Pack 3
Numerical scheme: Finite Volume (FV) [2]
Hardware used
Processor type: Intel Core 2 Quad CPU Q9450
Speed: 2.66 GHz
RAM: 4.00 GB
[2] The numerical solution of the shallow water equations (2D cases) uses an approximate Riemann solver (Roe’s scheme; Roe, 1981) to calculate the convective fluxes at the interface of the triangular and/or quadrangular cells/elements. Average gradients are estimated using the approach by Jawahar and Kamath, 2000. Numerical oscillations are avoided using a second order TVD slope limiter (Van Leer limiter; Hirch, 1990 and Darwish, 2003).
Model Parameters

Time increment (s): 0.02 (adaptive 0.001 - 0.02)
Flood and Dry: Drying depth = 0.001, Flooding depth = 0.002 & Wetting depth = 0.005
Eddy viscosity (m2/s): Smagorinsky formulation (default)
Bed resistance: Manning's M = 100


Model Results
Grid resolution (m): 38053 nodes / 38690 elements
Total simulation time (s): 149
Animation of water surface elevations in first 30-seconds of simulation (m)

Animation of velocities in first 30-seconds of simulation (m/s)


Detailed comparison of MIKE FLOOD FM modelled water surface elevations and UCL laboratory observations (click to enlarge).
Animation of water surface elevations showing development of hydraulic jump (m)
.
.
Thursday, 5 November 2009
Example tidal inundation model at Winterton-on-Sea, Great Yarmouth, UK using SRTM digital land topography data
Introduction

Location; Environment Agency Flood Zone Map (no allowance for sea level rise due to climate change)
Bathymetry
SRTM (Shuttle Radar Topography Mission) data is available in a 3 arc-second (90.0m grid resolution) for the UK. The vertical accuracy of SRTM data can be several metres (or more!). As such, SRTM data is not recommended for detailed assessment of flooding / inundation at a particular location and has been used in this example only to provide a coarse, initial estimate of likely model extents and an approximation of overland flow mechanisms (please read the Important Information at the bottom of this page).
In this example, the SRTM height data has been assumed to approximately correlate to Ordnance Datum (OD) Newlyn. However, this may not the case. SRTM heights are referenced to the EGM96 vertical datum. As such, SRTM data must be checked and verified for accuracy. If it can be demonstrated that SRTM data closely corresponds to Ordnance Datum, it may be possible in certain circumstances to use the data in conjunction with LiDAR and physical (GPS) topographic surveys in order to greatly extend a model domain only - this is not guaranteed. However, SAR (Synthetic Aperture Radar) data may offer a more generally acceptable solution to extend a model domain [1].
The SRTM data has been downloaded from http://dds.cr.usgs.gov/srtm/
[1] See https://www1.vtrenz.net/imarkownerfiles/ownerassets/868/brochure_IFSAR.pdf for an example comparison of SAR based data (IFSAR from Intermap) with LiDAR; information on the Environment Agency’s LiDAR data can be found here http://www.geomatics-group.co.uk/
The raw data has been converted for use in MIKE FLOOD using 3DEM by Visualization Software LLC and ESRI ArcGIS / MIKE URBAN; in order to transform the horizontal and vertical planar grid resolution to 50.0m.

Bathymetry; transformed 3 arc-second grid SRTM data (50.0m grid resolution)
Assumed Tidal Flood Levels
A quick search of available on-line data[2] suggests that I in 200-year extreme sea levels (storm surge levels) along the east coast could be in the order of 3.0m A.O.D or higher at Lowestoft to 4.6m or higher at Cromer. As such, the 1 on 200-year extreme sea level at Winterton-on-Sea could be in the order of 3.9m A.O.D or higher.
A quick search of available on-line data[2] suggests that I in 200-year extreme sea levels (storm surge levels) along the east coast could be in the order of 3.0m A.O.D or higher at Lowestoft to 4.6m or higher at Cromer. As such, the 1 on 200-year extreme sea level at Winterton-on-Sea could be in the order of 3.9m A.O.D or higher.
PPS25 requires that a sea level rise of approximately 1.1m is added to the above extreme sea level to consider the long term impacts of climate change over a 100-year design life of building (residential standard).
For the purpose of this example, from the above, the 1 in 200-year tidal flood level plus climate change for Winterton-on-Sea has been taken to be 5.0m A.O.D. This value has been taken to represent the peak of an approximate 3-day period (sinusoidal) storm surge.
Wave action will exacerbate flooding, particularly along the coast, but has been ignored for the purpose of this example. River flow will also increase flooding but has again been ignored for the purpose of this example.
The boundary conditions of the hydrodynamic model are simplistically assumed to be uniformly level. As such, a point time series file has been used throughout (see below). However, in reality, the tidal flood levels will vary over this short stretch of coastline and a profile time series could be more appropriate / accurate.

Tidal boundary conditions; assumed 3-day period 1 in 200-year tide levels plus climate change
[2] 'ESTIMATES OF EXTREME SEA CONDITIONS Final Report SPATIAL ANALYSES FOR THE UK COAST' - Mark J. Dixon and Jonathan A. Tawn (Department of Mathematics and Statistics, Lancaster University, Lancaster LA1 4YF in collaboration with The Proudman Oceanographic Laboratory, Bidston Observatory, Birkenhead, Merseyside L43 7RA) - June 1997; 'Great Yarmouth and Gorleston Strategic Flood Risk Assessment' - Capita Symonds - June 2006; 'Integrated analysis of risks of coastal flooding and cliff erosion under scenarios of long term change' - R. J. Dawson, M. E. Dickson, R. J. Nicholls, J. W. Hall, M. J. A. Walkden, P. K. Stansby, M. Mokrech, J. Richards, J. Zhou, J. Milligan, A. Jordan, S. Pearson, J. Rees, P. D. Bates, S. Koukoulas, A. R. Watkinson - January 2009
Model Parameters
Map projection: WGS_1984_UTM_Zone_31N
Time step interval: 10.0s
Flood and Dry: Drying depth = 0.002 / Flooding depth = 0.003
Initial surface elevation: 0.0m (from file)
Eddy Viscosity[3]: Constant, flux based = 2.0
Resistance: Manning's M = 33.3
[3] Eddy viscosity: The most suitable eddy viscosity formulation for models of this type is often the Smagorinsky model but this formulation may potentially create instabilities in combination with significant flooding and drying. The safe and recommended approach in such applications is to choose the constant eddy viscosity description. Furthermore, the 'flux based' formulation is recommended as practical experience has shown that the velocity based formulation can potentially cause numerical instabilities. A rule of thumb guestimate of the eddy viscosity constant is 0.02 Δx Δy / Δt [m2/s]
Model Results
Approximate 1 in 200-year flood depths (Scale 0.0m to 10.0m)
Approximate 1 in 200-year flood velocities (Scale 0.0m/s to 5.0m/s)

Approximate 1 in 200-year (high risk) flood extents presented in Google Earth
Subscribe to:
Posts
(Atom)
Follow DHI...


