Showing posts with label DEMO. Show all posts
Showing posts with label DEMO. Show all posts
Tuesday, 8 February 2011
Example tidal inundation model at Sutton Harbour, Plymouth using standard structures available within MIKE 21 Flexible Mesh
Introduction
 The Sutton Harbour area of Plymouth is defended against tidal flooding primarily by a system of lock gates at the entrance to the inner harbour. It is understood that the defended level afforded by the lock gates is 4.03m A.O.D (although a number of openings in the parapet wall of the southern harbour wall may slightly compromise the level of defence). This example investigates the suitability of the existing defences to accommodate a 1 in 200-year tidal event plus an allowance for climate change.
 LIDAR data, for use in the model, was obtained from the Channel Coastal Observatory Data Catalogue here http://www.channelcoast.org/. Downloading data and reports from the Channel Coastal Observatory Data Catalogue is currently free of charge (registration is required).
Introduction

Additional notes: It is assumed that all surface water outfalls into the inner harbour have been bypassed; hence, flooding from urban drainage has been ignored. No assessment of wave height has been included within this example. The aerial photograph above was obtained from the Channel Coastal Observatory Data Catalogue (see below).

Additional notes: CCO LIDAR data was verified by comparison with EA LIDAR data and augmented by additional depth values.
Tuesday, 20 April 2010
Simulation of dam break flow around buildings using a high-resolution MIKE FLOOD FM (Flexible Mesh) model
Introduction
The following example is intended to augment the MIKE FLOOD Classic (SG) results presented within the forthcoming Environment Agency Science Report 'Benchmarking of 2D Hydraulic Modelling Packages'. Information on this study can currently be found in the 'Desktop Review of 2D Hydraulic Software Packages' report; available here (opens PDF document).
This dam break test has been adapted from an original benchmark test case available from the IMPACT project (IMPACT, 2004; Soares-Frazao and Zech, 2002), for which measurements from a physical laboratory model at the Civil Engineering Laboratory of the Université Catholique de Louvain (UCL) are available. The test involves a simple topography, a dam with a 1.0m wide opening, and an idealised representation of a single building downstream of the dam.

Software used
Product: MIKE FLOOD FM (Flexible Mesh)
Version: 2009 including Service Pack 3
Numerical scheme: Finite Volume (FV) [2]
Hardware used
Processor type: Intel Core 2 Quad CPU Q9450
Speed: 2.66 GHz
RAM: 4.00 GB
Model Parameters
 Model bathymetry: Triangular elements have been used to improve the definition of the building as above (quadrangular elements have been used elsewhere, at an approximate grid resolution of 0.1m, particularly to improve definition of model bathymetry along the base slopes and to refine flow through the gate opening).
Time increment (s): 0.02 (adaptive 0.001 - 0.02)
Flood and Dry: Drying depth = 0.001, Flooding depth = 0.002 & Wetting depth = 0.005
Eddy viscosity (m2/s): Smagorinsky formulation (default)
Bed resistance: Manning's M = 100
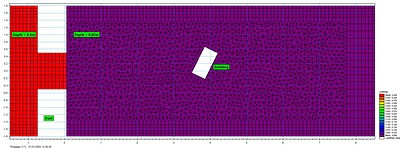 Initial conditions: Uniform depths of 0.4m upstream from the dam and 0.02m downstream from the dam.
 Boundary conditions: Flow is contained by vertical walls at all boundaries of the model domain (only a section of the full model is presented above).
Model Results
Grid resolution (m): 38053 nodes / 38690 elements
Total simulation time (s): 149
 Maximum water surface elevations reached during the simulation (m); transformed 0.05m grid resolution.
 Maximum velocities reached during the simulation (m/s); transformed 0.05m grid resolution.
 MIKE 21 Flow Model FM point series output locations.
 Plot of water surface elevation against time for all point series output locations (m)
 Plot of velocity against time for all point series output locations (m/s)

Introduction
The following example is intended to augment the MIKE FLOOD Classic (SG) results presented within the forthcoming Environment Agency Science Report 'Benchmarking of 2D Hydraulic Modelling Packages'. Information on this study can currently be found in the 'Desktop Review of 2D Hydraulic Software Packages' report; available here (opens PDF document).
This dam break test has been adapted from an original benchmark test case available from the IMPACT project (IMPACT, 2004; Soares-Frazao and Zech, 2002), for which measurements from a physical laboratory model at the Civil Engineering Laboratory of the Université Catholique de Louvain (UCL) are available. The test involves a simple topography, a dam with a 1.0m wide opening, and an idealised representation of a single building downstream of the dam.
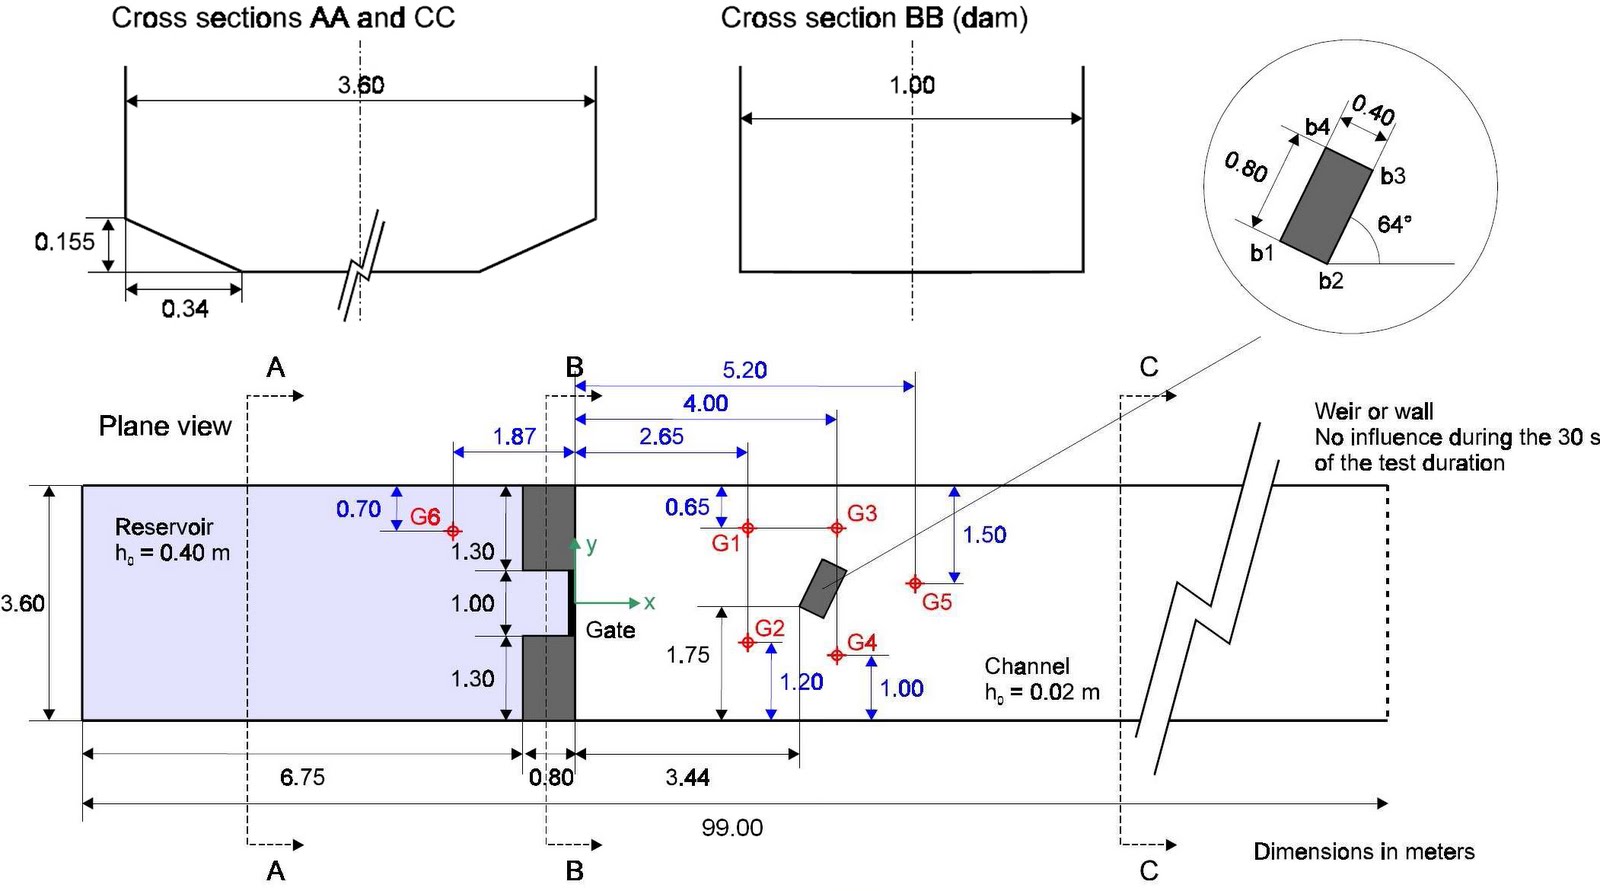
Model Set-up (adapted from Soares-Frazao and Zech, 2002).
[1] The SOARES-FRAZAO, S. AND ZECH, Y., 2002 Dam break flow experiment (Isolated building test case) is available online at http://www.impact-project.net/wp3_technical.htm
Software used
Product: MIKE FLOOD FM (Flexible Mesh)
Version: 2009 including Service Pack 3
Numerical scheme: Finite Volume (FV) [2]
Hardware used
Processor type: Intel Core 2 Quad CPU Q9450
Speed: 2.66 GHz
RAM: 4.00 GB
[2] The numerical solution of the shallow water equations (2D cases) uses an approximate Riemann solver (Roe’s scheme; Roe, 1981) to calculate the convective fluxes at the interface of the triangular and/or quadrangular cells/elements. Average gradients are estimated using the approach by Jawahar and Kamath, 2000. Numerical oscillations are avoided using a second order TVD slope limiter (Van Leer limiter; Hirch, 1990 and Darwish, 2003).
Model Parameters

Time increment (s): 0.02 (adaptive 0.001 - 0.02)
Flood and Dry: Drying depth = 0.001, Flooding depth = 0.002 & Wetting depth = 0.005
Eddy viscosity (m2/s): Smagorinsky formulation (default)
Bed resistance: Manning's M = 100


Model Results
Grid resolution (m): 38053 nodes / 38690 elements
Total simulation time (s): 149
Animation of water surface elevations in first 30-seconds of simulation (m)

Animation of velocities in first 30-seconds of simulation (m/s)


Detailed comparison of MIKE FLOOD FM modelled water surface elevations and UCL laboratory observations (click to enlarge).
Animation of water surface elevations showing development of hydraulic jump (m)
.
.
Thursday, 5 November 2009
Example tidal inundation model at Winterton-on-Sea, Great Yarmouth, UK using SRTM digital land topography data
Introduction

Location; Environment Agency Flood Zone Map (no allowance for sea level rise due to climate change)
Bathymetry
SRTM (Shuttle Radar Topography Mission) data is available in a 3 arc-second (90.0m grid resolution) for the UK. The vertical accuracy of SRTM data can be several metres (or more!). As such, SRTM data is not recommended for detailed assessment of flooding / inundation at a particular location and has been used in this example only to provide a coarse, initial estimate of likely model extents and an approximation of overland flow mechanisms (please read the Important Information at the bottom of this page).
In this example, the SRTM height data has been assumed to approximately correlate to Ordnance Datum (OD) Newlyn. However, this may not the case. SRTM heights are referenced to the EGM96 vertical datum. As such, SRTM data must be checked and verified for accuracy. If it can be demonstrated that SRTM data closely corresponds to Ordnance Datum, it may be possible in certain circumstances to use the data in conjunction with LiDAR and physical (GPS) topographic surveys in order to greatly extend a model domain only - this is not guaranteed. However, SAR (Synthetic Aperture Radar) data may offer a more generally acceptable solution to extend a model domain [1].
The SRTM data has been downloaded from http://dds.cr.usgs.gov/srtm/
[1] See https://www1.vtrenz.net/imarkownerfiles/ownerassets/868/brochure_IFSAR.pdf for an example comparison of SAR based data (IFSAR from Intermap) with LiDAR; information on the Environment Agency’s LiDAR data can be found here http://www.geomatics-group.co.uk/
The raw data has been converted for use in MIKE FLOOD using 3DEM by Visualization Software LLC and ESRI ArcGIS / MIKE URBAN; in order to transform the horizontal and vertical planar grid resolution to 50.0m.

Bathymetry; transformed 3 arc-second grid SRTM data (50.0m grid resolution)
Assumed Tidal Flood Levels
A quick search of available on-line data[2] suggests that I in 200-year extreme sea levels (storm surge levels) along the east coast could be in the order of 3.0m A.O.D or higher at Lowestoft to 4.6m or higher at Cromer. As such, the 1 on 200-year extreme sea level at Winterton-on-Sea could be in the order of 3.9m A.O.D or higher.
A quick search of available on-line data[2] suggests that I in 200-year extreme sea levels (storm surge levels) along the east coast could be in the order of 3.0m A.O.D or higher at Lowestoft to 4.6m or higher at Cromer. As such, the 1 on 200-year extreme sea level at Winterton-on-Sea could be in the order of 3.9m A.O.D or higher.
PPS25 requires that a sea level rise of approximately 1.1m is added to the above extreme sea level to consider the long term impacts of climate change over a 100-year design life of building (residential standard).
For the purpose of this example, from the above, the 1 in 200-year tidal flood level plus climate change for Winterton-on-Sea has been taken to be 5.0m A.O.D. This value has been taken to represent the peak of an approximate 3-day period (sinusoidal) storm surge.
Wave action will exacerbate flooding, particularly along the coast, but has been ignored for the purpose of this example. River flow will also increase flooding but has again been ignored for the purpose of this example.
The boundary conditions of the hydrodynamic model are simplistically assumed to be uniformly level. As such, a point time series file has been used throughout (see below). However, in reality, the tidal flood levels will vary over this short stretch of coastline and a profile time series could be more appropriate / accurate.

Tidal boundary conditions; assumed 3-day period 1 in 200-year tide levels plus climate change
[2] 'ESTIMATES OF EXTREME SEA CONDITIONS Final Report SPATIAL ANALYSES FOR THE UK COAST' - Mark J. Dixon and Jonathan A. Tawn (Department of Mathematics and Statistics, Lancaster University, Lancaster LA1 4YF in collaboration with The Proudman Oceanographic Laboratory, Bidston Observatory, Birkenhead, Merseyside L43 7RA) - June 1997; 'Great Yarmouth and Gorleston Strategic Flood Risk Assessment' - Capita Symonds - June 2006; 'Integrated analysis of risks of coastal flooding and cliff erosion under scenarios of long term change' - R. J. Dawson, M. E. Dickson, R. J. Nicholls, J. W. Hall, M. J. A. Walkden, P. K. Stansby, M. Mokrech, J. Richards, J. Zhou, J. Milligan, A. Jordan, S. Pearson, J. Rees, P. D. Bates, S. Koukoulas, A. R. Watkinson - January 2009
Model Parameters
Map projection: WGS_1984_UTM_Zone_31N
Time step interval: 10.0s
Flood and Dry: Drying depth = 0.002 / Flooding depth = 0.003
Initial surface elevation: 0.0m (from file)
Eddy Viscosity[3]: Constant, flux based = 2.0
Resistance: Manning's M = 33.3
[3] Eddy viscosity: The most suitable eddy viscosity formulation for models of this type is often the Smagorinsky model but this formulation may potentially create instabilities in combination with significant flooding and drying. The safe and recommended approach in such applications is to choose the constant eddy viscosity description. Furthermore, the 'flux based' formulation is recommended as practical experience has shown that the velocity based formulation can potentially cause numerical instabilities. A rule of thumb guestimate of the eddy viscosity constant is 0.02 Δx Δy / Δt [m2/s]
Model Results
Approximate 1 in 200-year flood depths (Scale 0.0m to 10.0m)
Approximate 1 in 200-year flood velocities (Scale 0.0m/s to 5.0m/s)

Approximate 1 in 200-year (high risk) flood extents presented in Google Earth
Wednesday, 19 August 2009
Demonstration model of tidal flows around Guernsey and Sark, The Channel Islands, for renewable energy production
Introduction
The Channel Islands have one of the highest resources of tidal flow energy in the United Kingdom. This simple modelling exercise has been undertaken in order to demonstrate the functionality and capability of MIKE 21 to investigate the viability of harnessing the tidal flows around Guernsey and Sark for energy production.


Defining the Hydrodynamic Model

Define model domain; import shoreline data, redistributing vertices to prepare for mesh generation

Increase definition at study area

Create computational mesh; increase definition in study area

Bathymetry data; depth values extracted from MIKE C-MAP for greater accuracy at study area

Bathymetry data; ETOPO1 1-minute grid (Amante, C. and B. W. Eakins, ETOPO1 1 Arc-Minute Global Relief Model: Procedures, Data Sources and Analysis, National Geophysical Data Center, NESDIS, NOAA, U.S. Department of Commerce, Boulder, CO, August 2008)

Interpolated bathymetry; water depths (study area) relative to Chart Datum [1]

Mean Sea Levels relative to Chart Datum

Adjusted model bathymetry; water depths relative to Mean Sea Level

Assign tidal boundary conditions to East & West boundaries; line time series generated using MIKE 21 Toolbox (prediction based on global tide model data)
West boundary
Model Results

Calibration against UKHO tidal predictions for St Peter Port over the study period; good correlation, parameters are appropriate for the purpose of this modelling exercise
Animation of tidal current velocities; The Channel
Animation of tidal current velocities; Channel Islands
Animation of tidal current velocities; Guernsey & Sark

Introduce turbine structures between Guernsey & Sark; Turbine 1 (North) & Turbine 2 (South). Assumed parameters; Turbine diameter = 16m, Drag coefficient = 0.4

Modelled turbine velocity (m/s); assumed criteria for viability > 1m/s (say 2m/s for spring tides)
The energy available from the turbines can (for example) be estimated as follows: -

Modelled turbine force (N)

Consider the effects of renewable energy installations in Alderney Race

Introduce pier structures. Assumed parameters; Height = 100m, Diameter = 25m.
The impact of these pier structures on modelled tidal current velocities is negligible in this example.
.
Introduction
The Channel Islands have one of the highest resources of tidal flow energy in the United Kingdom. This simple modelling exercise has been undertaken in order to demonstrate the functionality and capability of MIKE 21 to investigate the viability of harnessing the tidal flows around Guernsey and Sark for energy production.
Defining the Hydrodynamic Model
- A triangular element flexible mesh has been applied over the entire model domain; comprising 38679 Elements & 20405 Nodes
- An overall time step of 300 seconds has been selected. The duration of the simulation is 7 days (2016 overall time steps). The simulation period covers an arbitrary week from 03/07/2009 – 10/07/2009. as such, higher spring tides have not been considered in this example.
- The horizontal eddy viscosity type has been set to a velocity based Smagorinsky formulation with a constant value of 0.28
- The bed resistance type has been set to Manning number and a constant value of 32 m1/3/s applied
- Coriolis forcing has been set to varying in domain
- Wind forcing has not been considered
Define model domain; import shoreline data, redistributing vertices to prepare for mesh generation
Increase definition at study area
Create computational mesh; increase definition in study area
Bathymetry data; depth values extracted from MIKE C-MAP for greater accuracy at study area
Bathymetry data; ETOPO1 1-minute grid (Amante, C. and B. W. Eakins, ETOPO1 1 Arc-Minute Global Relief Model: Procedures, Data Sources and Analysis, National Geophysical Data Center, NESDIS, NOAA, U.S. Department of Commerce, Boulder, CO, August 2008)
Interpolated bathymetry; water depths (study area) relative to Chart Datum [1]
[1] Datum info: Chart Datum (CD) is usually equal to LAT in the UK (e.g. see http://www.ordnancesurvey.co.uk/oswebsite/partnerships/research/publications/docs/2003/ICZMAP_GISRUK_full_dm.pdf for height integration at the coastal zone). For a global relief model, like ETOPO2v2, which has 2 arc-minute (~4 km) cell size, the differences between vertical datums are considered to be not significant, so long as they are all near Mean Sea Level (MSL). As such, a height correction should be applied to datasets relative to Chart Datum (see below).
Mean Sea Levels relative to Chart Datum
Adjusted model bathymetry; water depths relative to Mean Sea Level
Assign tidal boundary conditions to East & West boundaries; line time series generated using MIKE 21 Toolbox (prediction based on global tide model data)
West boundary
Model Results
Calibration against UKHO tidal predictions for St Peter Port over the study period; good correlation, parameters are appropriate for the purpose of this modelling exercise
Animation of tidal current velocities; The Channel
Animation of tidal current velocities; Channel Islands
Animation of tidal current velocities; Guernsey & Sark
Introduce turbine structures between Guernsey & Sark; Turbine 1 (North) & Turbine 2 (South). Assumed parameters; Turbine diameter = 16m, Drag coefficient = 0.4
Modelled turbine velocity (m/s); assumed criteria for viability > 1m/s (say 2m/s for spring tides)
The energy available from the turbines can (for example) be estimated as follows: -
P = Cp x 0.5 x ρ x A x V³where: -
P = power generated (W)
Cp = turbine performance coefficient
ρ = water density (seawater ~ 1025 kg/m³)
A = sweep area of the turbine (m²)
V = flow velocity (m/s)
Modelled turbine force (N)
Consider the effects of renewable energy installations in Alderney Race
Introduce pier structures. Assumed parameters; Height = 100m, Diameter = 25m.
The impact of these pier structures on modelled tidal current velocities is negligible in this example.
.
Subscribe to:
Posts
(Atom)
Follow DHI...


